What Metrics Should We Focus on to Measure and Drive Product Growth?
Explore the power of targeted metrics to lift up your product's performance and user satisfaction.

I’ve spent years in the trenches of outsourced software development at 1985. I’ve seen firsthand how metrics can make or break a product. They aren’t just numbers on a spreadsheet. They are signals, warning bells, and stepping stones. They tell you where your product is thriving and where it’s stumbling.
In my experience, many teams dive headfirst into developing features without a clear view of the impact. That’s like driving blindfolded. With the right metrics, you see the road ahead. With the wrong ones, you might as well be guessing. Today, I’m laying out a guide to the metrics that matter. This is not a list of buzzwords. It’s a deep dive into what really drives product growth.
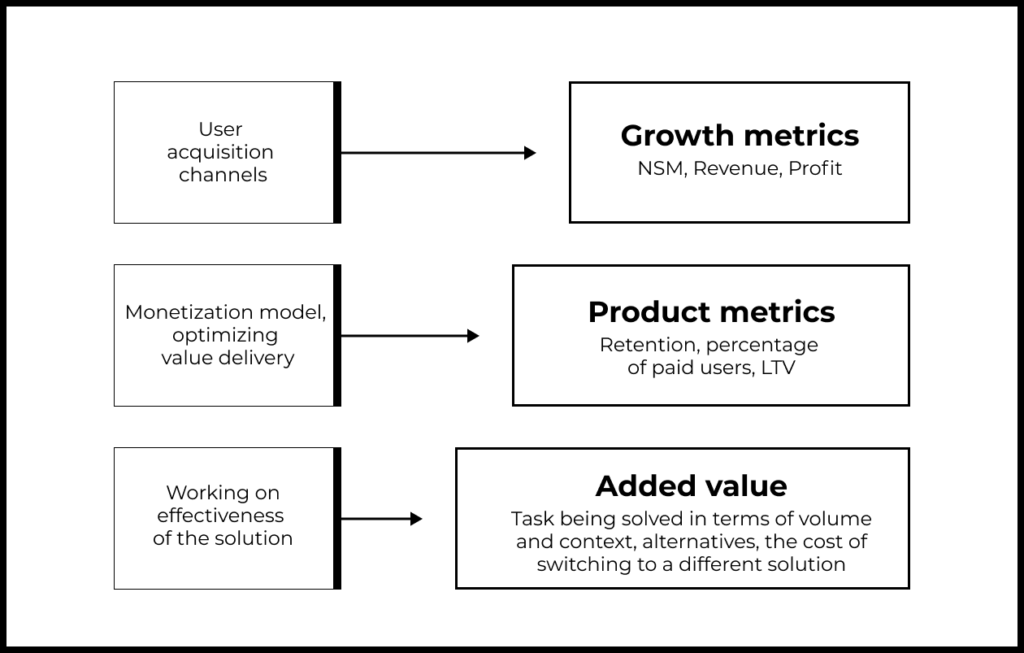
I’ve been fortunate to work with diverse clients, large enterprises to scrappy startups. Over time, I’ve learned that every product is different. Yet some metrics transcend industries and product types. They give you insight into your users, your development process, and ultimately, your bottom line.
Why Metrics Matter
Metrics are the compass and the map. They show you where you’ve been, where you are, and hint at where you can go. At 1985, we use metrics not just to validate our work but to spark conversation and action. When our team gathers around data, ideas flow. We learn from the numbers. We adapt.
Metrics provide a grounding reality check. In the fast-paced world of software, it’s easy to get carried away with flashy features. But without clear measurement, those features might be wasted energy. They might not connect with your users or drive growth. The right metrics help you prioritize what matters. They help you cut through noise.
Metrics also create accountability. When you know what’s being measured, you focus on what’s important. Every team member understands their role in driving growth. And when targets are met—or missed—you know exactly what to tweak. It’s a cycle of constant improvement.
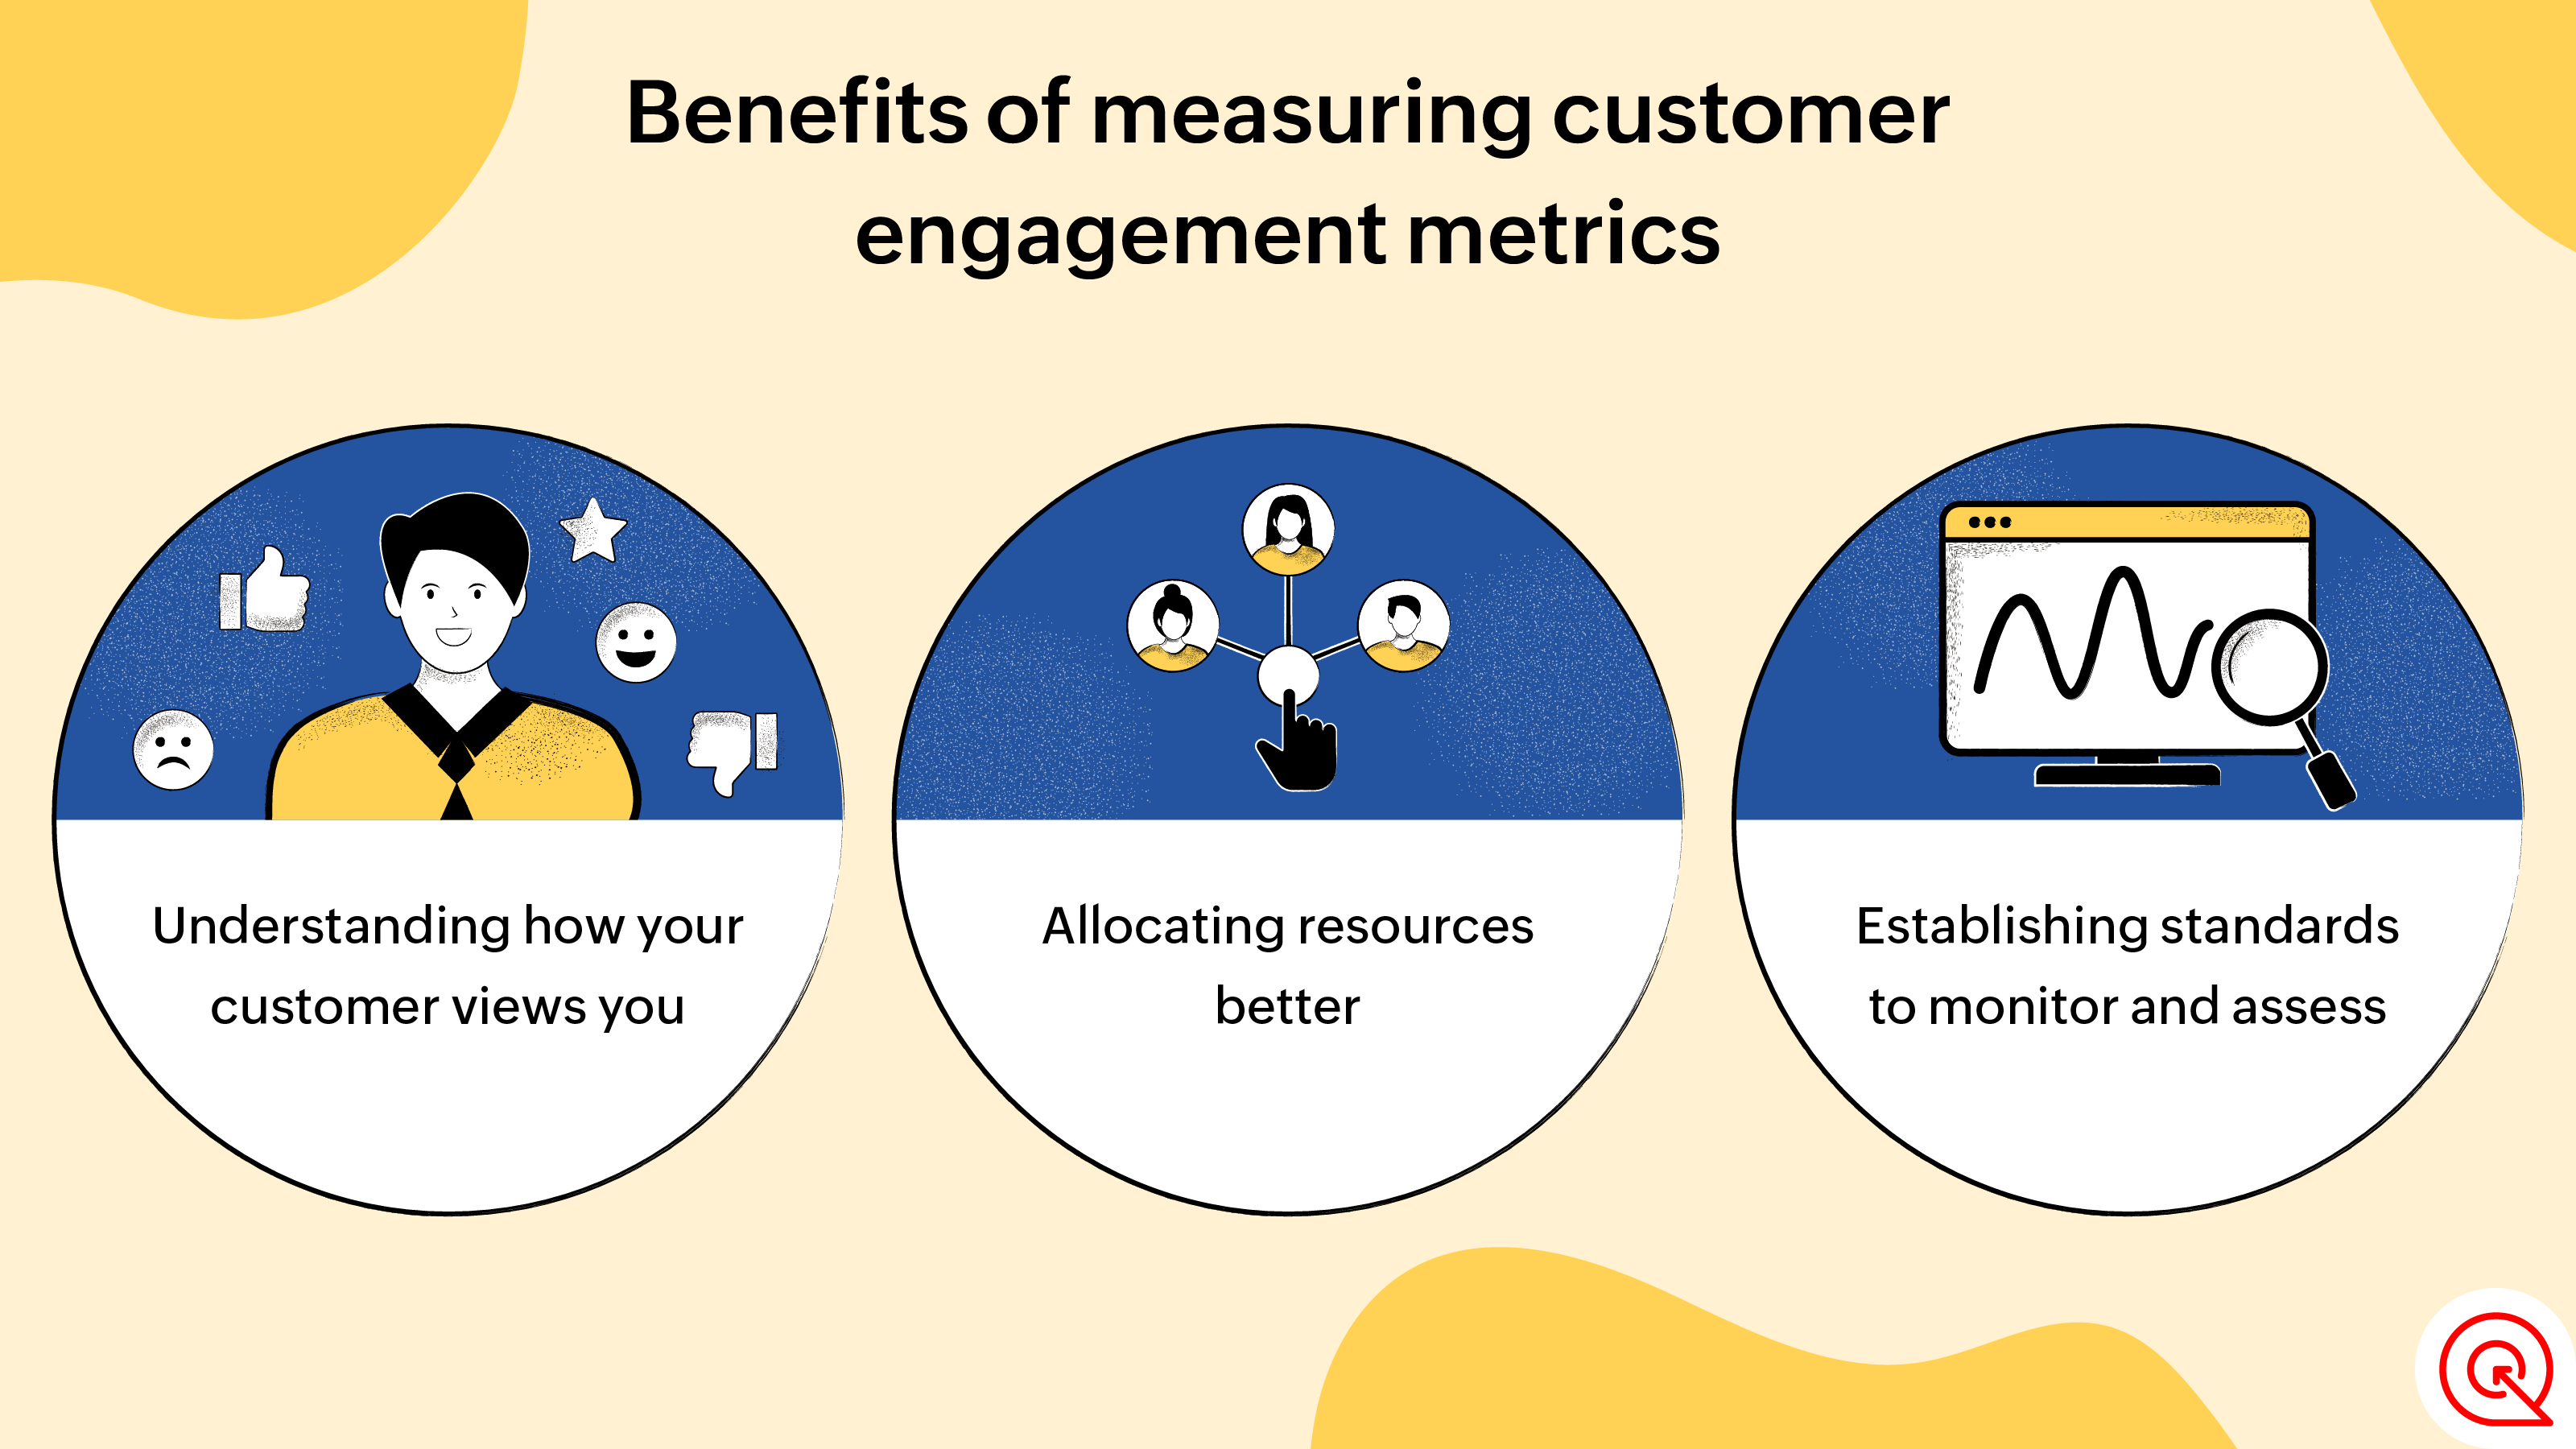
User-Centric Metrics
Engagement and Retention
Let’s talk about your users. Engagement isn’t just about sign-ups or page views. It’s about how deeply users connect with your product. Here’s where engagement and retention metrics come in.
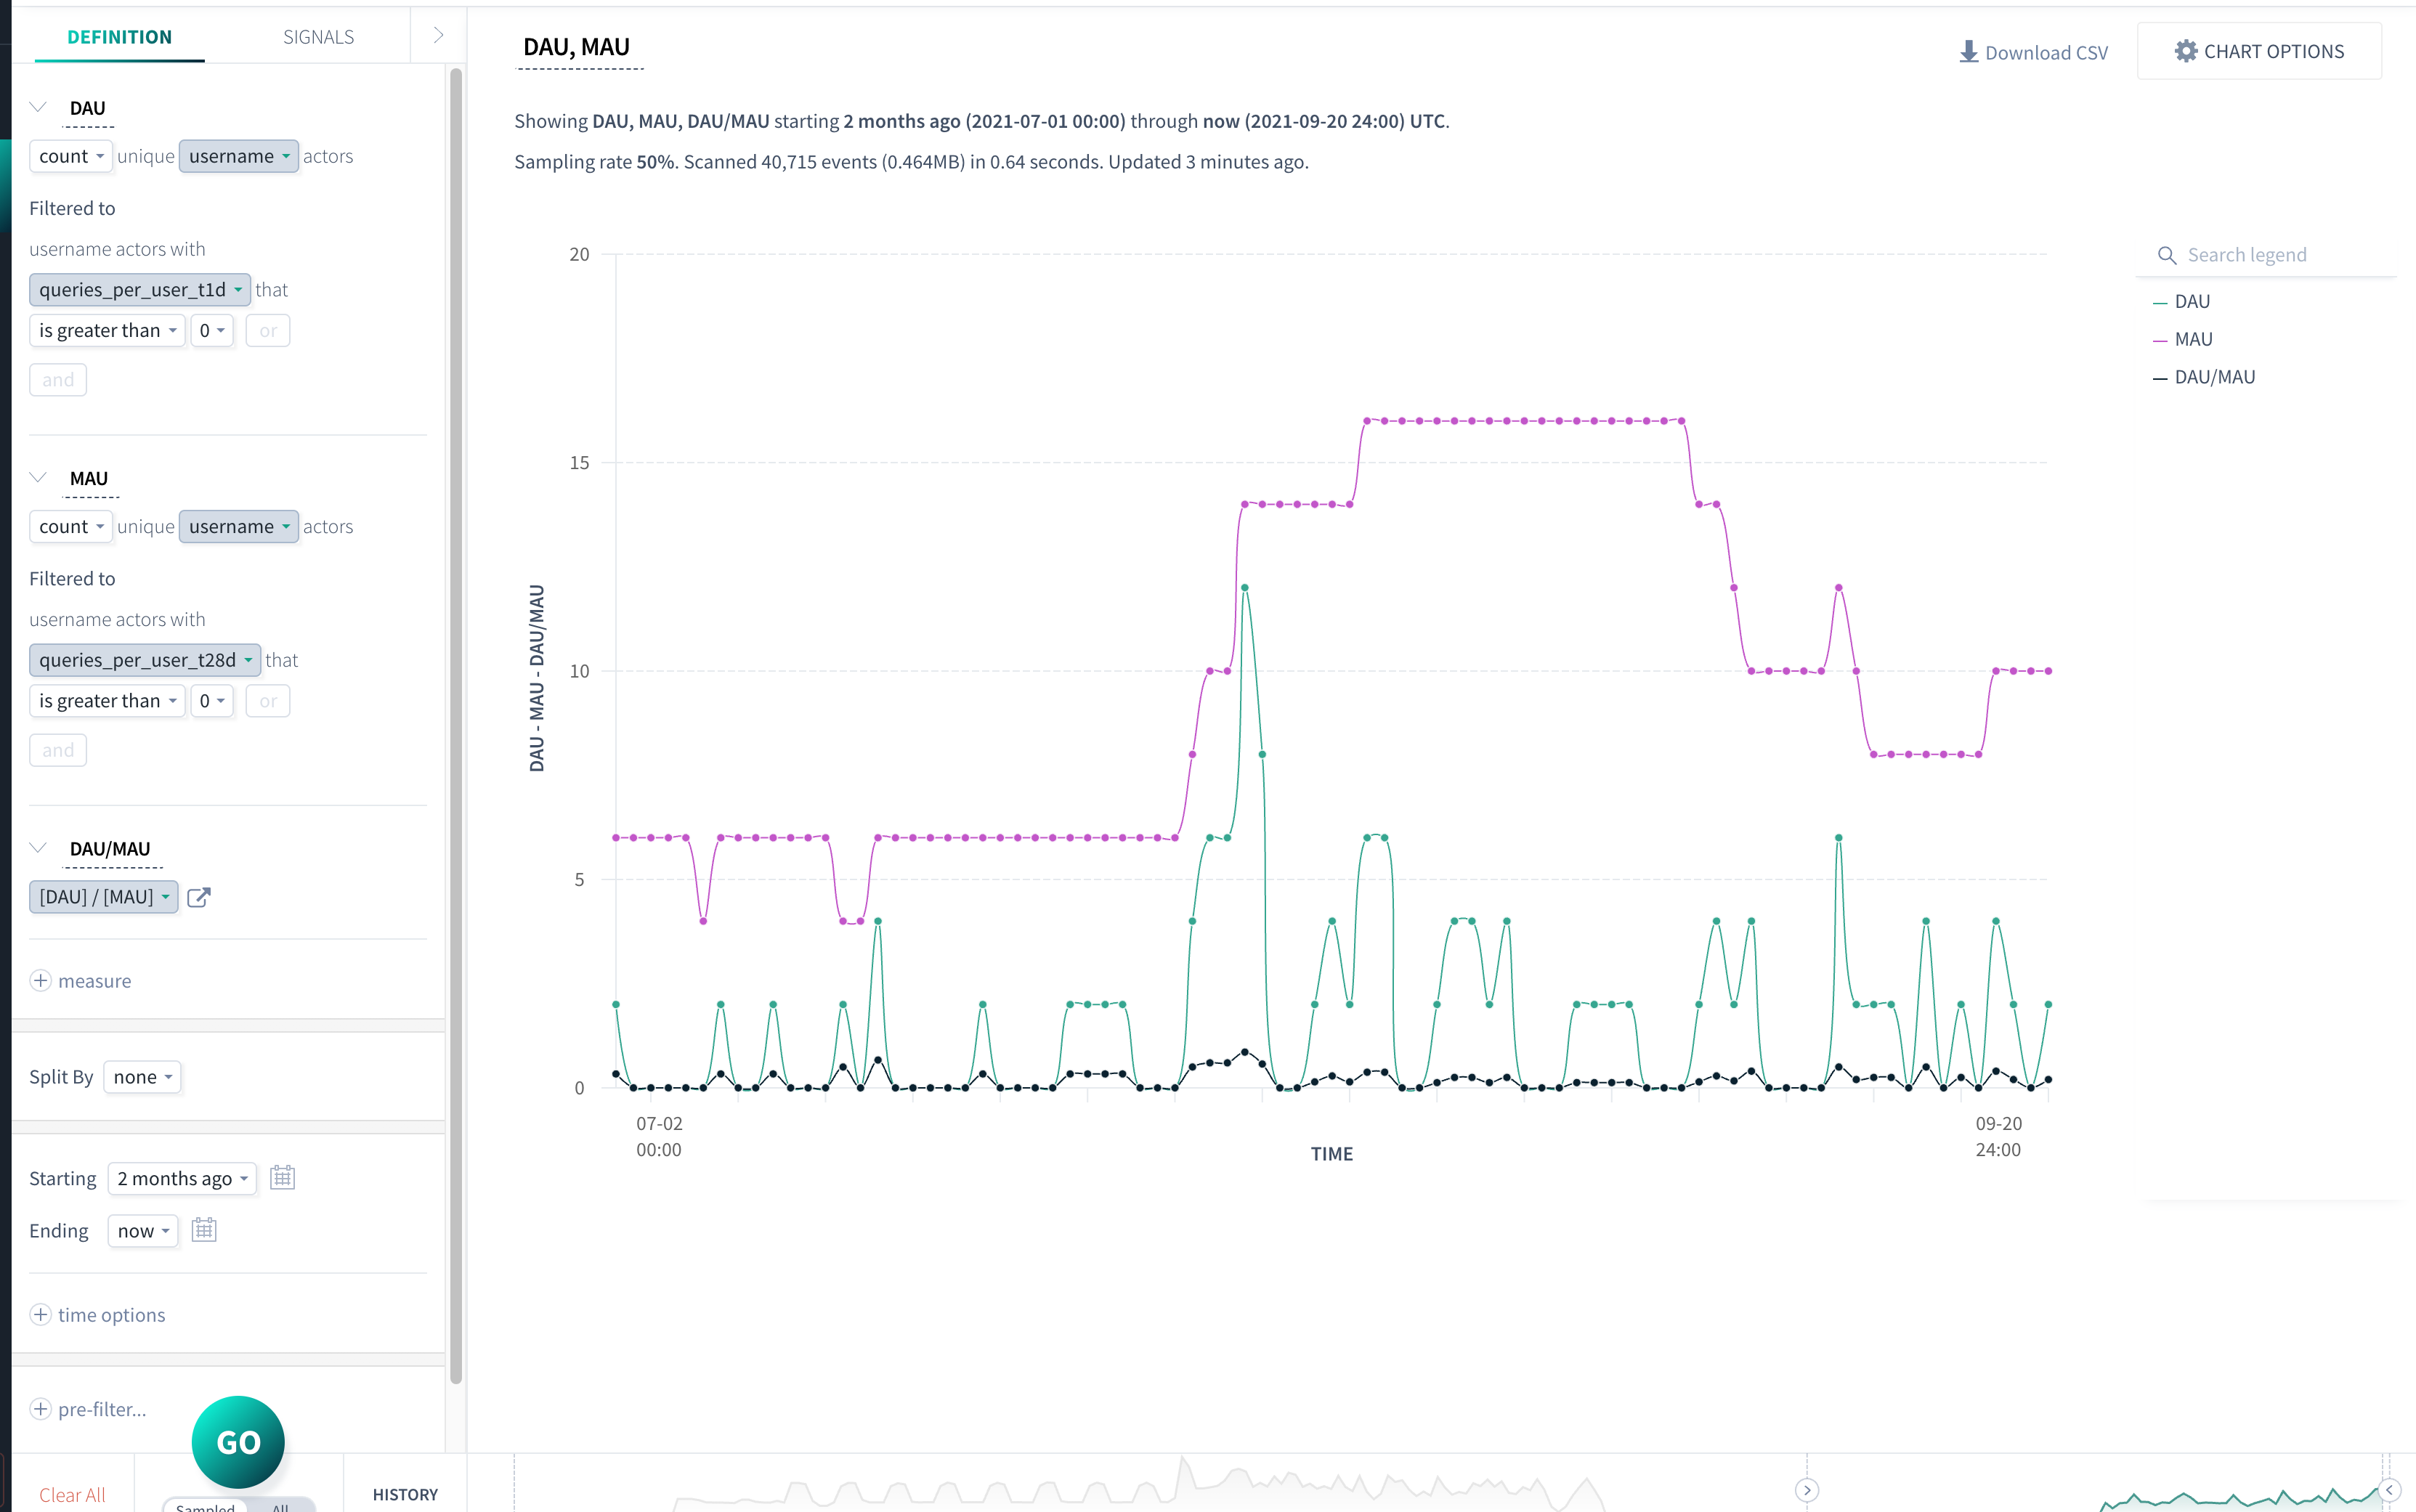
Daily Active Users (DAU) & Monthly Active Users (MAU)
DAU and MAU are common, yet critical, metrics. They give you a sense of your product’s stickiness. If your DAU/MAU ratio is high, users are coming back day after day. They’re finding value. If it’s low, then there’s a disconnect somewhere.
At 1985, we’ve seen projects where a DAU/MAU ratio above 20% was a strong indicator of a product’s health. It means that a significant portion of your user base is not only checking in but using your product as part of their daily routine.
Retention Rate
Retention goes beyond engagement. It measures whether your users stick around after their first experience. It’s a metric that tells you if your product is building lasting relationships. A great product isn’t just a fad—it’s something users rely on.
Retention can be measured at various intervals—7 days, 30 days, or even 90 days. The nuance matters. Early retention might indicate a strong first impression, but longer-term retention tells you if the product continues to deliver value.
In our own projects, a 30-day retention rate of over 40% has often signaled that our development strategies are paying off. That’s a sign that users see enough value to integrate the product into their routines.
Churn Rate
Churn is the flip side of retention. It’s the rate at which users abandon your product. High churn rates are a red flag. They signal dissatisfaction, poor onboarding, or a product that simply isn’t meeting expectations.
For a product to grow, understanding churn is essential. It might be the result of misaligned expectations or poor user experience. Once you have concrete data on why users leave, you can address the root cause. Often, the solution is iterative improvement rather than a complete overhaul.
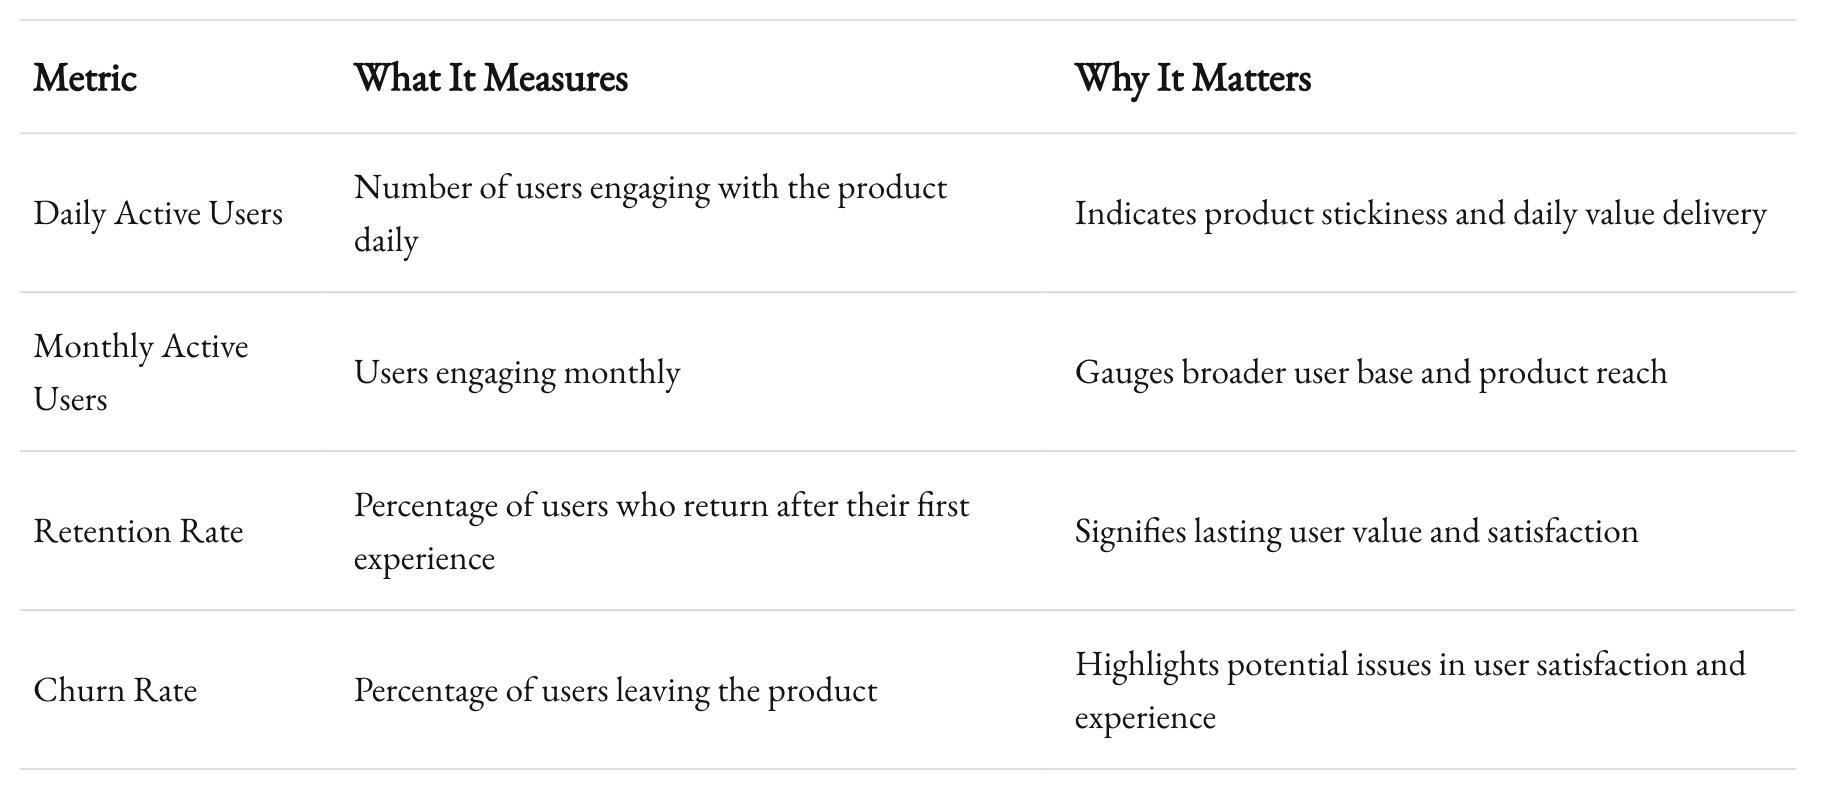
Each metric tells part of the story. When combined, they create a comprehensive picture of how users interact with your product. They let you see not only the bright spots but the areas in need of improvement.
User Behavior and Journey Analysis
Understanding how users interact with your product is crucial. It’s one thing to know the number of users; it’s another to know what they do when they’re in your product.
Feature Adoption
One of the most actionable metrics is feature adoption. It tells you which parts of your product are being used—and which aren’t. This data can guide your product roadmap. You might discover that a feature you thought was groundbreaking is barely used, while a simple, overlooked tool is a hit.
Feature adoption rates can be tracked using event-based analytics. Tools like Mixpanel or Amplitude can provide detailed insights into user behavior. With this data, you can focus your development efforts on refining successful features or rethinking underperforming ones.
User Journey Mapping
Mapping the user journey is another layer of insight. This process involves tracking the path users take from their first interaction to becoming loyal customers. By understanding the steps they follow—or the obstacles they encounter—you can fine-tune the experience.
For example, if users consistently drop off at the registration stage, it’s a sign to simplify the process. If they get lost in a complex dashboard, it’s time to rethink the interface. These insights drive product growth by directly informing how you can improve the user experience.
In-App Behavior
Don’t underestimate the value of in-app behavior metrics. They offer granular insights into user interactions. Which buttons do they click? How long do they spend on a particular screen? These details, while seemingly minute, can reveal significant trends.
At 1985, we use heatmaps and session recordings to complement quantitative data. The combination of hard numbers and qualitative insights is powerful. It gives you a full picture of how users engage with your product and where improvements can be made.
Business Metrics: Beyond the User
User metrics are critical, but they are just one piece of the puzzle. To truly drive product growth, you need to look at business metrics. These metrics link product performance to revenue and profitability.
Customer Acquisition Cost (CAC) and Lifetime Value (LTV)
These two metrics are the cornerstone of growth strategies. They help you understand the balance between the cost of acquiring a user and the revenue that user brings over time.

Customer Acquisition Cost (CAC)
CAC is not just a number—it represents the investments you make in marketing, sales, and onboarding. Lowering CAC without sacrificing quality is a constant challenge. You need to optimize campaigns, refine your targeting, and streamline your sales funnel.
In the outsourced software space, where budgets can be tight and competition fierce, knowing your CAC is vital. Every dollar saved on acquisition can be reinvested in product development or customer success initiatives.
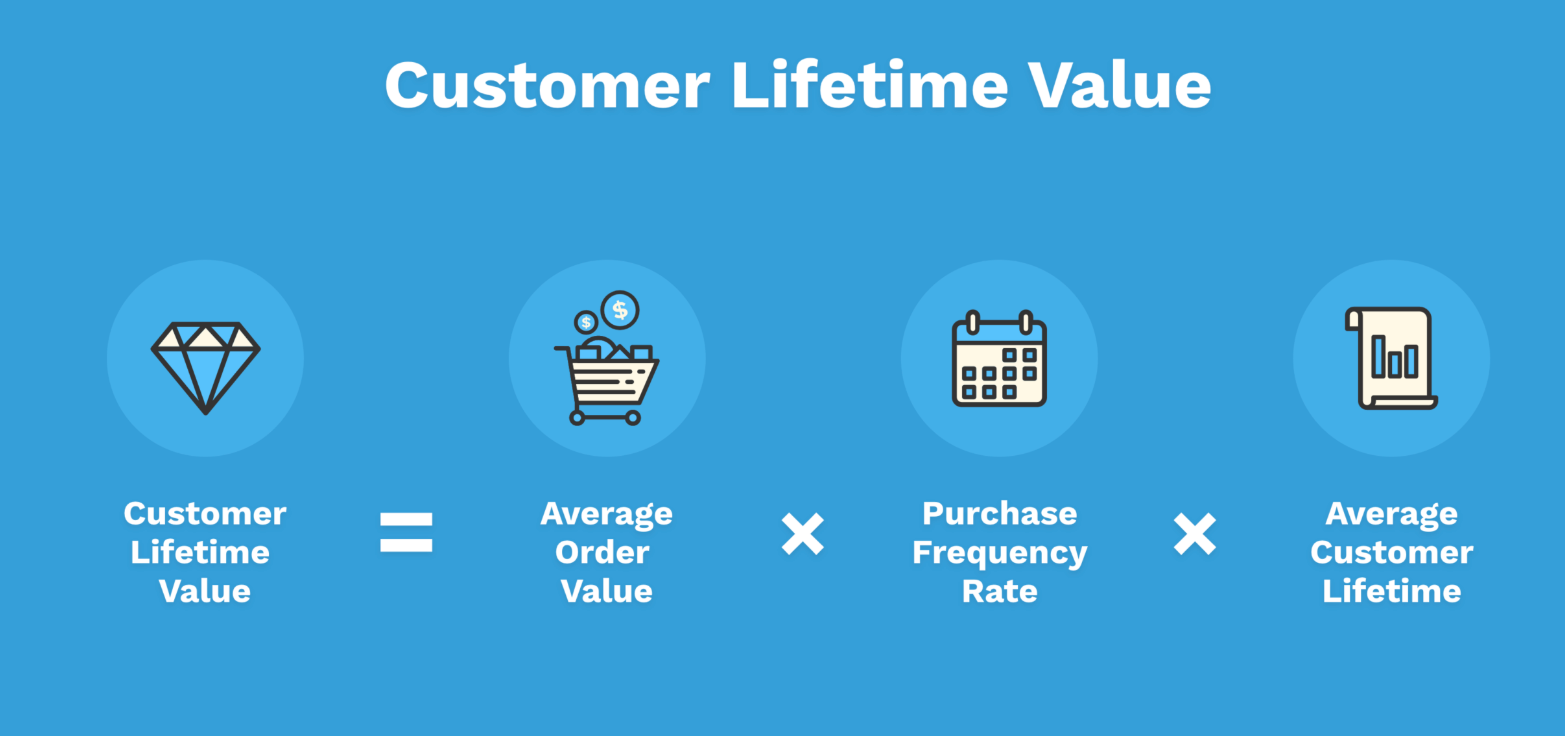
Lifetime Value (LTV)
LTV estimates the total revenue a user will generate over their entire relationship with your product. The goal is to see an LTV that significantly exceeds your CAC. When this balance is right, growth is sustainable.
For instance, if your CAC is $100 and your LTV is $300, you’re in a healthy growth zone. However, if the LTV is lower than CAC, it’s a clear sign that your customer acquisition strategy needs rethinking.
By focusing on both CAC and LTV, you ensure that every marketing dollar contributes to long-term growth. It’s a dynamic balance, one that requires regular monitoring and adjustments.

Revenue and Profitability Metrics
When talking about growth, revenue is king. But raw revenue numbers don’t tell the full story. You need to understand profitability, margins, and the financial health of your product.
Recurring Revenue Metrics
For many software products, recurring revenue is the lifeblood. Monthly recurring revenue (MRR) or annual recurring revenue (ARR) are standard metrics. They provide predictable income and are a strong indicator of a product’s market fit.
At 1985, our clients appreciate the clarity that recurring revenue metrics provide. They help in forecasting and budgeting, enabling more strategic long-term planning. A steady or growing MRR/ARR is a sign that the product is not only popular but financially sustainable.
Gross Margin and Profitability
Gross margin is another critical metric. It tells you how much of your revenue remains after direct costs. This metric is essential for outsourced software projects, where margins can be razor-thin.
By monitoring gross margins, you can pinpoint inefficiencies. If your margin is low, it might be time to streamline operations or re-negotiate vendor contracts. Profitability metrics ensure that growth doesn’t come at the cost of financial health.
Revenue Growth Rate
The revenue growth rate shows how fast your product is scaling financially. It’s a dynamic indicator of market traction. A consistent upward trend signals that your product is gaining momentum. But abrupt dips can be warning signs.
For instance, a startup in the outsourcing realm may see rapid early growth. But if the revenue growth rate stalls, it’s a clear indicator that market conditions or product issues need addressing. Balancing growth with sustainable revenue is a constant juggling act.

Engineering and Process Metrics
In an outsourced software development environment, engineering metrics are equally crucial. They don’t just measure technical performance—they indirectly influence product growth by ensuring quality and speed.
Development Velocity
Development velocity measures the pace at which your team delivers new features and fixes bugs. It’s a key performance indicator for your engineering team. A steady velocity is essential. It shows that your team is not only keeping up with demands but also innovating.
Velocity isn’t just about speed. It’s about sustainable progress. Pushing too hard can lead to burnout and quality issues. Instead, focus on a balanced pace that allows for iteration and improvement. At 1985, we encourage our teams to maintain a steady rhythm that respects both deadlines and code quality.
Cycle Time
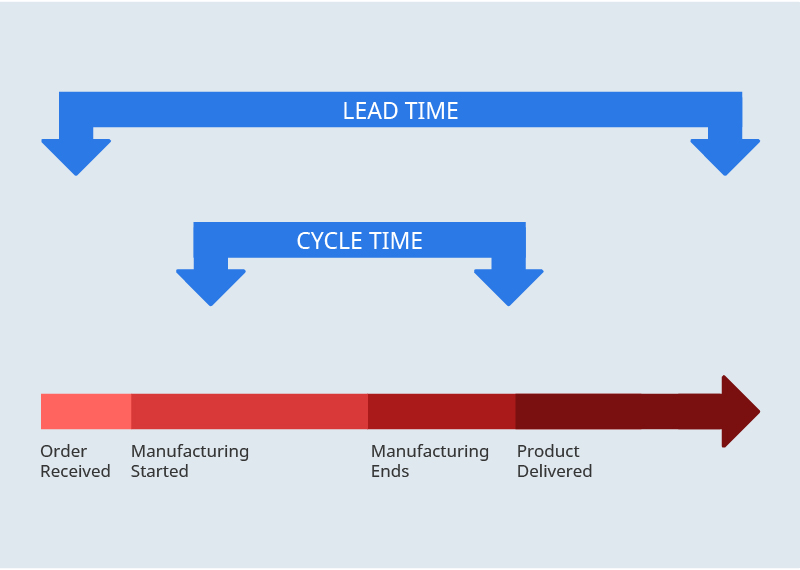
Cycle time is the duration it takes for a feature to go from idea to deployment. Short cycle times mean you’re quickly adapting to user needs. In a fast-changing market, the ability to iterate rapidly is a significant competitive advantage.
Reducing cycle time can be achieved by streamlining development processes, removing bottlenecks, and leveraging agile methodologies. A shorter cycle time means that you can test new ideas, get feedback, and make improvements much faster. It’s a metric that directly correlates with responsiveness and adaptability.

Quality Metrics: Bugs, Technical Debt, and Beyond
Quality is a cornerstone of any successful product. Bugs, performance issues, and technical debt can derail growth. They create friction for users and erode trust.
Defect Density
Defect density measures the number of defects per unit of code. It’s an essential indicator of code quality. A high defect density might suggest rushed releases or inadequate testing. Reducing it often requires a combination of better coding practices, rigorous testing, and automated quality checks.
For outsourced software development, maintaining a low defect density is critical. It ensures that the product remains robust even as new features are added. This metric is a silent guardian of user satisfaction.
Technical Debt
Technical debt represents the implied cost of additional rework caused by choosing an easy solution now over a better approach. It’s like a hidden cost that accumulates interest over time. When technical debt is high, it slows down innovation. It makes every new feature more cumbersome to implement.
At 1985, we are very aware of technical debt. We prioritize refactoring and investing time in improving our codebase. When technical debt is managed properly, it creates room for smoother, faster growth in the long run.
Uptime and Performance
A product’s uptime and performance are non-negotiable. Users expect a smooth experience. Metrics like uptime percentage, load time, and response time can make or break user satisfaction. Even a slight dip in performance can lead to lost trust and increased churn.
Implementing robust monitoring tools and performance analytics is essential. At 1985, we regularly review these metrics to ensure our products perform at their peak. High performance builds reliability and reinforces user confidence.
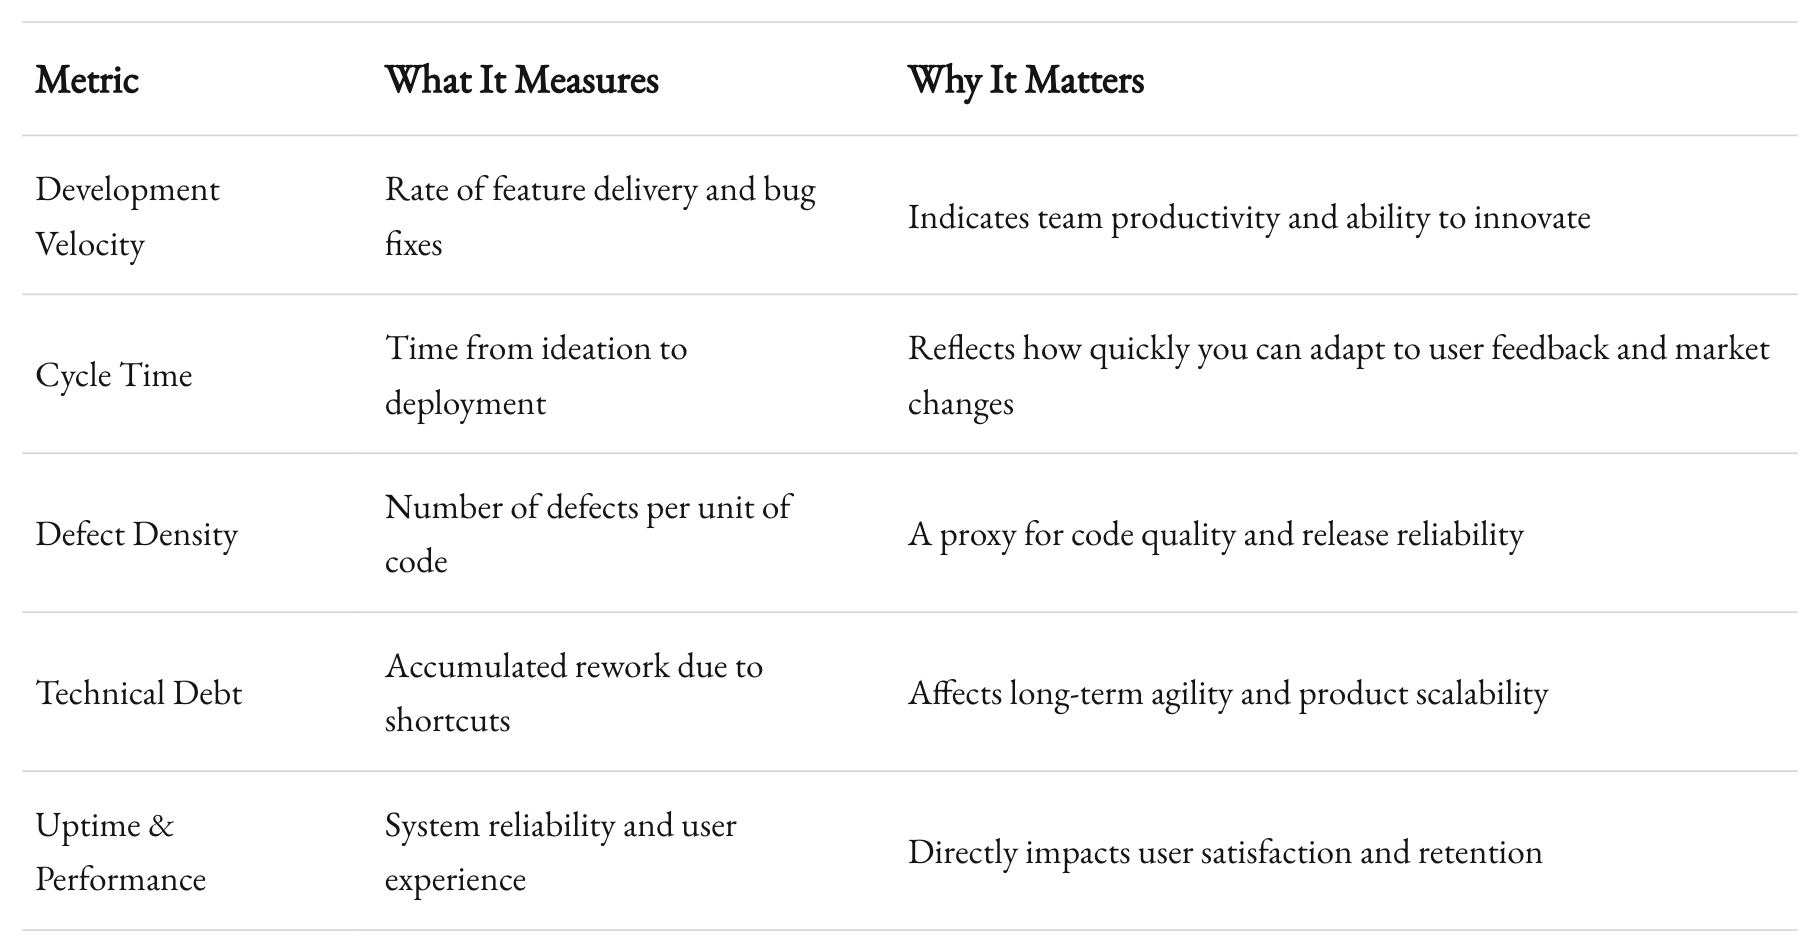
Each of these metrics tells a part of the story. They interlink and provide a holistic view of your product’s development and operational health. In our world, where outsourced development demands precision and agility, tracking these metrics isn’t optional—it’s essential.
The Interplay Between Metrics and Strategy
Metrics are not standalone figures. They drive decisions, influence strategy, and align teams. It’s important to understand how these numbers interplay and support your overall vision.
Aligning Metrics with Business Goals
At 1985, every metric we track ties back to a business goal. Whether it’s improving user retention, reducing churn, or increasing revenue, each number is a stepping stone toward a larger objective. This alignment ensures that your entire team is rowing in the same direction.
Take the relationship between CAC and LTV. When you see a disparity, it’s not just a number—it’s a signal that your marketing and product strategies need recalibration. Metrics provide the insight to pivot quickly and efficiently.
Actionable Insights and Continuous Improvement
Metrics are only as good as the actions they drive. It’s not enough to simply measure; you must act on the insights. This requires a culture of continuous improvement. At 1985, we hold regular review sessions. We discuss what the numbers mean, what’s working, and what isn’t. This transparency fosters a culture of accountability and innovation.
For instance, if user engagement metrics reveal that a specific feature is underperforming, we dig deeper. Is it an issue with usability? Does it require better onboarding? The answers drive our next steps. In many cases, small tweaks—like simplifying an interface or clarifying messaging—can have a big impact on user satisfaction and retention.
The Feedback Loop
A successful product is built on a continuous feedback loop. Metrics inform improvements. Improvements drive better metrics. It’s a virtuous cycle. The sooner you can see this loop in action, the more dynamic and responsive your product becomes.
Consider how feature adoption and user journey mapping work together. When you notice a drop-off at a certain point, you can immediately experiment with adjustments. This iterative process is crucial in today’s fast-paced market. It’s about constant refinement—keeping your product in sync with user needs and market demands.
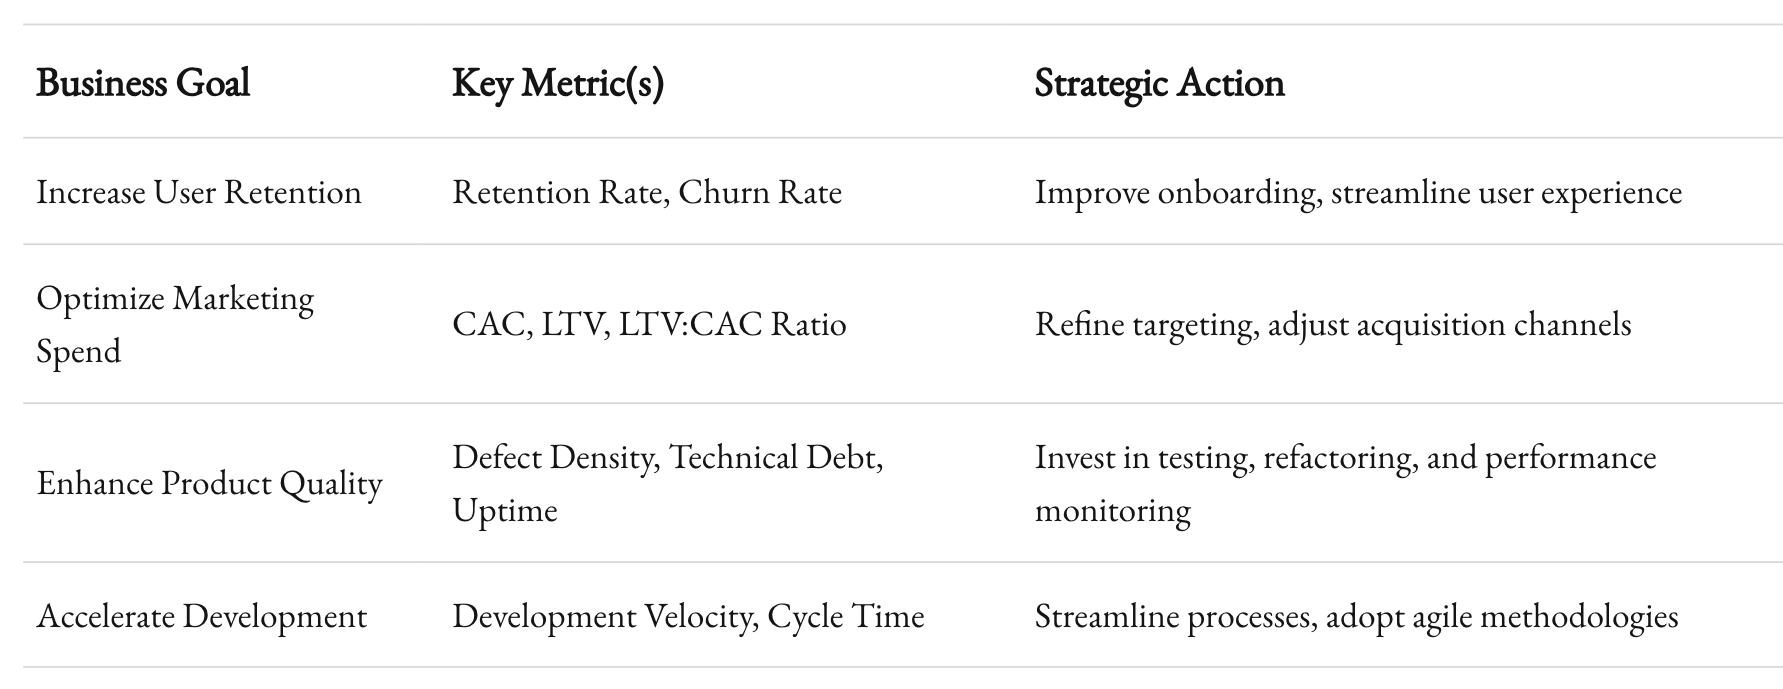
Each strategic action is underpinned by data. When every team member understands the “why” behind a decision, execution becomes sharper and more focused. This level of alignment is what drives sustainable product growth.
Advanced Metrics: Beyond the Surface
In the realm of outsourced software development, advanced metrics can offer even deeper insights. These are the numbers that can help you predict future trends and preempt challenges before they become critical.

Predictive Analytics and Machine Learning
The use of predictive analytics is gaining traction. By leveraging historical data, you can forecast user behavior and product performance. Machine learning models can analyze patterns that might not be immediately obvious. They can predict churn, forecast revenue growth, and even suggest new features that might resonate with users.
At 1985, we’ve experimented with these models. While it’s not a silver bullet, predictive analytics provides a valuable supplement to traditional metrics. It helps you stay ahead of the curve. Imagine knowing that a particular cohort is likely to churn in the next quarter. With that insight, you can proactively address the issue.
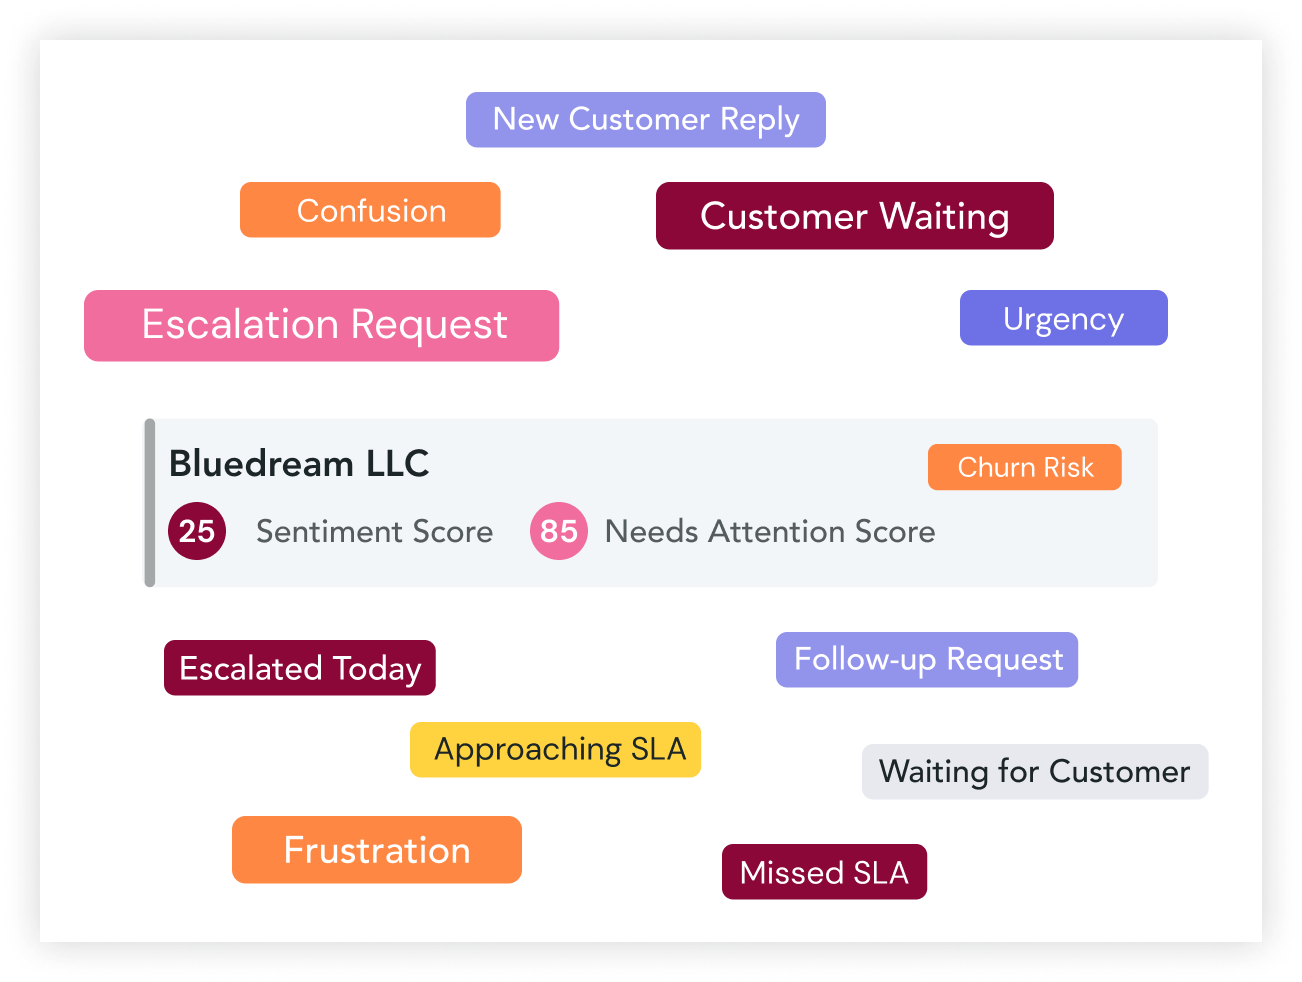
Customer Sentiment Analysis
Quantitative data tells you what is happening. But sometimes, you need to know why. Customer sentiment analysis involves tracking user feedback from multiple channels—support tickets, social media, in-app surveys—and quantifying it. This qualitative insight is often the missing link between raw numbers and user behavior.
Advanced sentiment analysis tools can parse large volumes of text to detect emerging trends in user opinion. Whether it’s frustration over a recurring bug or excitement about a new feature, understanding sentiment adds a layer of nuance that pure numbers can’t capture.
Cohort Analysis
Cohort analysis goes beyond overall user metrics. By grouping users based on shared characteristics or behaviors, you can identify trends that might be hidden in aggregated data. It’s particularly useful for identifying long-term value and understanding the impact of product changes over time.
For example, you might find that users who join during a specific campaign have a higher LTV. Or that a particular onboarding flow leads to better retention. These insights allow you to tailor your strategies to maximize growth. It’s about working smarter, not just harder.

These advanced metrics represent the cutting edge of product management. They require sophisticated tools and a willingness to invest in data science. But the payoff can be significant. When you can predict and influence user behavior, you’re no longer playing catch-up—you’re setting the pace.
Integrating Metrics into Your Workflow
Metrics are only as valuable as your ability to integrate them into your daily workflow. At 1985, we’ve developed processes to ensure that data is at the heart of every decision. Here are some strategies for weaving metrics into your operational fabric.
Regular Data Reviews
Set aside time for regular data reviews. These sessions are not just about numbers—they’re about storytelling. They’re an opportunity for the team to understand the product’s performance and brainstorm solutions.
In our weekly meetings, we break down key metrics and discuss what’s driving changes. We examine spikes and dips. We look for patterns. These reviews are collaborative and candid. Everyone’s voice is heard. The goal is to transform data into actionable insights.
Cross-Functional Collaboration
Metrics should not live in silos. They need to be shared across teams—from engineering and design to marketing and sales. When everyone understands the numbers, you build a culture of shared accountability.
For instance, when the development team sees that cycle time is increasing, it sparks conversations with product managers about potential bottlenecks. Similarly, if the customer success team notices a trend in support tickets related to a specific feature, it informs the product roadmap. Cross-functional collaboration ensures that every department is aligned toward the same goals.
Real-Time Dashboards
Investing in real-time dashboards can be a game-changer. These dashboards provide instant insights into key performance metrics. Whether it’s a spike in user activity or a dip in uptime, real-time data enables you to react immediately.
Tools like Grafana, Tableau, or custom-built dashboards can help visualize the data. At 1985, we’ve built dashboards that aggregate data from multiple sources. This integration means that when something goes awry, we’re not left in the dark. We can quickly assess the situation and take corrective action.
Experimentation and Iteration
No metric is perfect. Use your data to run experiments. Implement A/B tests to see what changes yield the best results. The process of experimentation creates a feedback loop where every hypothesis is tested, validated, or discarded.
At 1985, we’ve run countless experiments. Sometimes, the data confirmed our intuition. Other times, it challenged our assumptions. This iterative process is the engine of product growth. Each experiment, regardless of its outcome, provides invaluable insights that inform future decisions.
Case Studies: Metrics in Action
Let’s step back from theory. I want to share some real-life examples from our journey at 1985. These case studies highlight how we used metrics to drive product growth for our clients.
Case Study 1: Revamping User Onboarding
One of our projects was a SaaS platform struggling with user retention. The numbers were clear: the 7-day retention rate was abysmally low. We dug deeper into the user journey and discovered that the onboarding process was convoluted. Users were confused from the start.
We ran an A/B test comparing the old onboarding flow with a simplified version. The new flow focused on clear, step-by-step instructions. We also implemented in-app prompts that guided users through key features. The results were dramatic. The 7-day retention rate improved by 35% within just a few weeks.
The takeaway? Metrics don’t just point out problems—they guide you to the solution. By focusing on user behavior metrics and running experiments, we transformed a weak onboarding process into a strong competitive advantage.
Case Study 2: Optimizing Feature Adoption
Another client had invested heavily in developing a suite of features. Yet usage data told a different story. One flagship feature, which the client believed would be a game-changer, was hardly used. We performed a deep dive into feature adoption metrics and conducted user interviews. The findings were illuminating. The feature was buried within the interface, and users didn’t even know it existed.
We redesigned the interface to highlight the feature, added tooltips, and integrated user feedback into the design process. Over the next quarter, the adoption rate of the feature increased by over 50%. This wasn’t just a win for feature adoption—it had a ripple effect on overall user engagement and satisfaction.
Case Study 3: Streamlining Development for Faster Releases
In the fast-paced world of outsourced software development, speed is essential. One of our teams faced challenges with long cycle times, which delayed feature releases. We implemented agile methodologies and invested in automation tools. By tracking cycle time closely and identifying bottlenecks, we were able to reduce the average cycle time by 25%.
This improvement allowed the team to roll out new features faster. The impact was immediate: user feedback was positive, and the accelerated release cycle contributed to a surge in user engagement. It was a clear demonstration of how internal process metrics directly influence product growth.
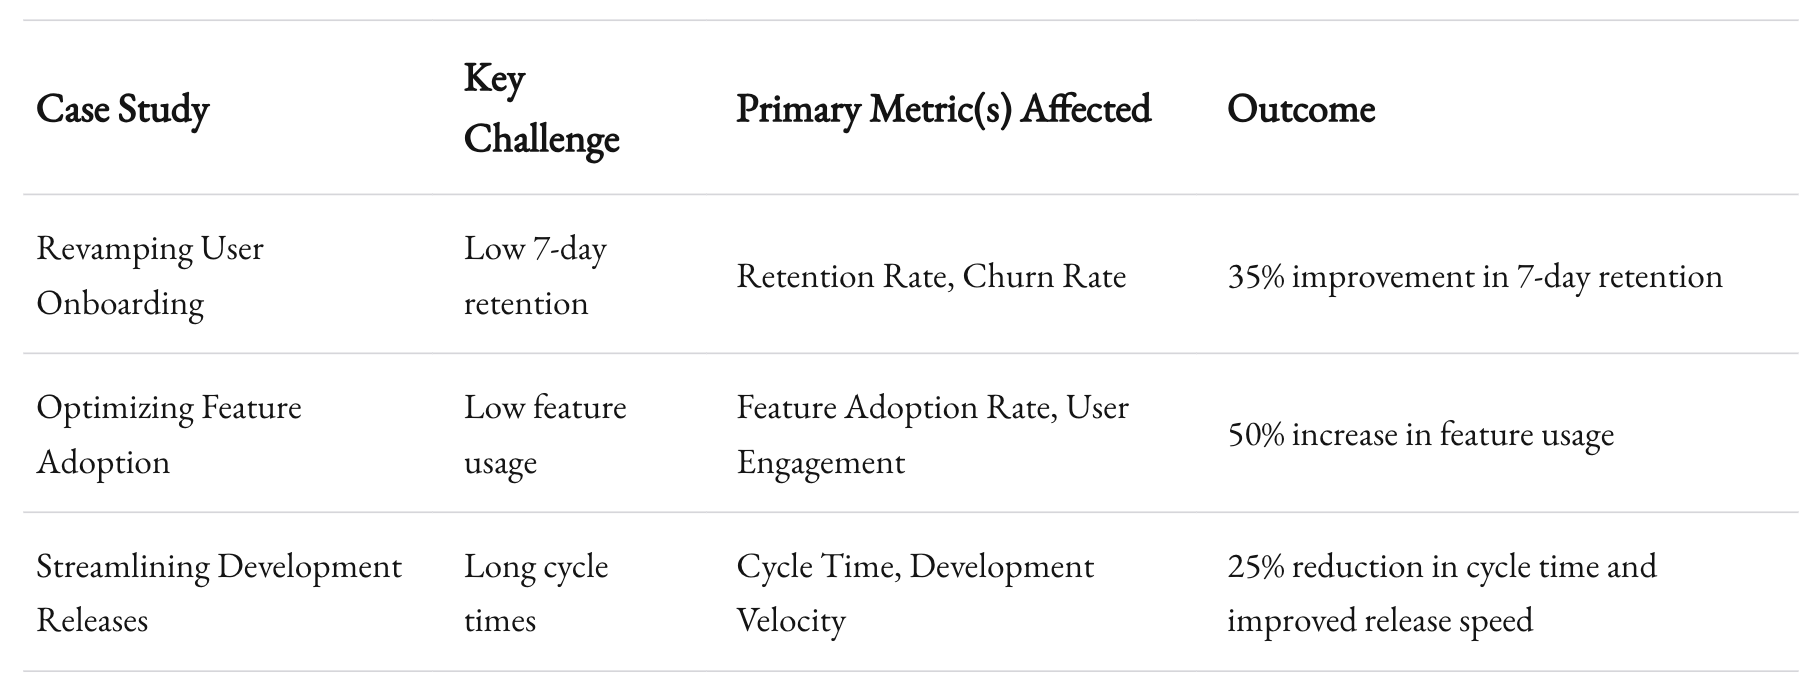
These case studies aren’t isolated incidents. They are a testament to the power of metrics when integrated into a proactive strategy. At 1985, we live and breathe data. It informs every decision, drives every improvement, and fuels our commitment to delivering value.
Building a Data-Driven Culture
Metrics are powerful tools, but they require a supportive culture to truly make an impact. A data-driven culture isn’t just about having the right tools; it’s about fostering an environment where every team member values insight and accountability.
Leadership and Vision
Leaders set the tone. When leadership at 1985 champions the use of metrics, it trickles down. Every project, every sprint, and every meeting has data at its core. It becomes second nature to ask: “What do the numbers say?” This inquiry drives innovation and improvement.
Leaders must also be transparent about the data. Sharing successes, failures, and lessons learned builds trust. It encourages teams to take calculated risks. When you know that every experiment is backed by data, the fear of failure diminishes. Instead, it becomes an opportunity for growth.
Training and Empowerment
A data-driven culture requires that everyone is on board. This means training and empowerment. It’s essential to provide teams with the tools and knowledge to interpret metrics accurately. Regular workshops, training sessions, and cross-team discussions can demystify data analysis.
At 1985, we invest in training our teams on how to use analytics tools, read dashboards, and understand the significance of key metrics. This empowerment leads to more informed decisions and a proactive approach to problem-solving.
Celebrating Data Wins
Don’t forget to celebrate your successes. When a metric improves, recognize the team’s effort. This not only boosts morale but reinforces the value of a data-driven approach. At the end of the day, metrics are about people. They’re about the dedication, creativity, and hard work that goes into building a successful product.
Recap
There is no silver bullet. There is no single metric that will guarantee success. Growth is a complex, multifaceted beast. But with the right metrics, you have the tools to tame it.
At 1985, we’ve seen firsthand how focusing on nuanced, targeted metrics can transform a product. From user engagement to development efficiency, every metric has a story to tell. It’s up to you to listen, analyze, and act on those insights.
Metrics are not just numbers. They’re a narrative of your product’s journey. They guide your strategy, reveal hidden opportunities, and spotlight areas for improvement. In a world where every decision can have a significant impact, having a clear, data-driven approach isn’t optional—it’s essential.
Remember: Your metrics are your allies. They offer clarity in a chaotic environment. They help you navigate the complex interplay between user behavior, product development, and market trends. And ultimately, they empower you to make decisions that drive sustainable growth.
I invite you to dive deep into your own data. Challenge assumptions. Experiment boldly. And let the metrics guide your journey. In our experience, the insights you uncover will not only improve your product—they’ll transform the way you work.
Keep it simple. Keep it smart. Let every decision be informed by real, actionable data. That’s the key to growth in the outsourced software development landscape and beyond.
Happy measuring. Happy growing.


